Industrial Intelligence Platform
Where Factory Data
Meets Precision
Engineering
Altiora Dynamics builds industrial monitoring systems, real-time data pipelines, and operator dashboards — turning raw process signals into operational clarity.
System Status
OPERATIONAL
Data Latency
12ms
Active Endpoints
48
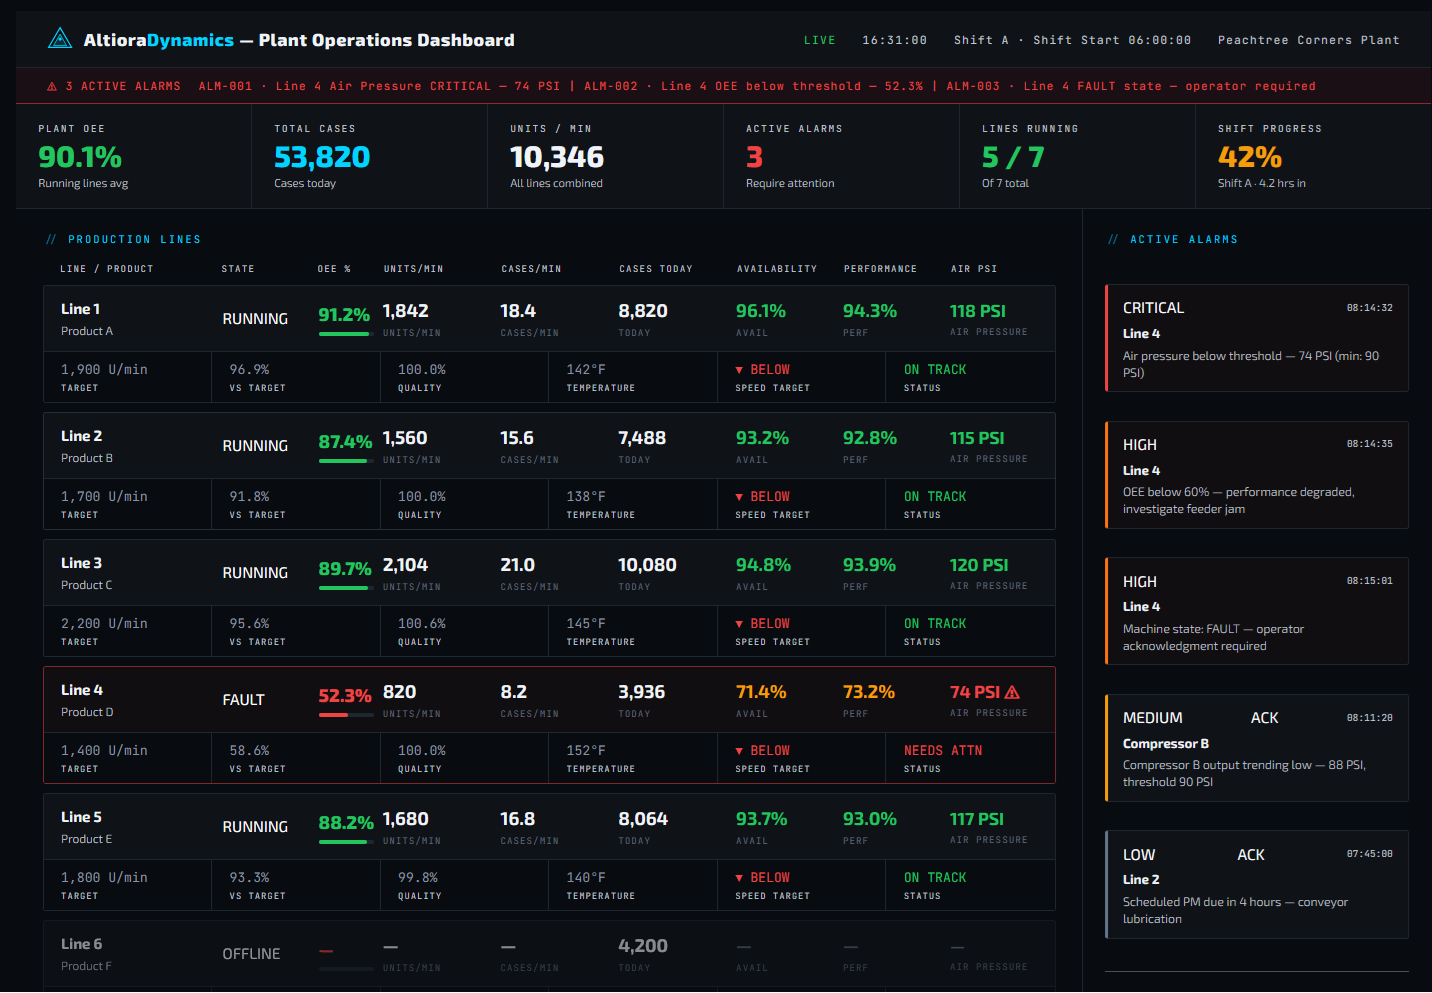
Live Plant Operations Dashboard